
Recommendation Block Analytics
eSputnik starts collecting statistics on the recommendation block from the moment it is published.
To view the report's details, click on the name of the recommendation in the list and go to the Analytics tab.
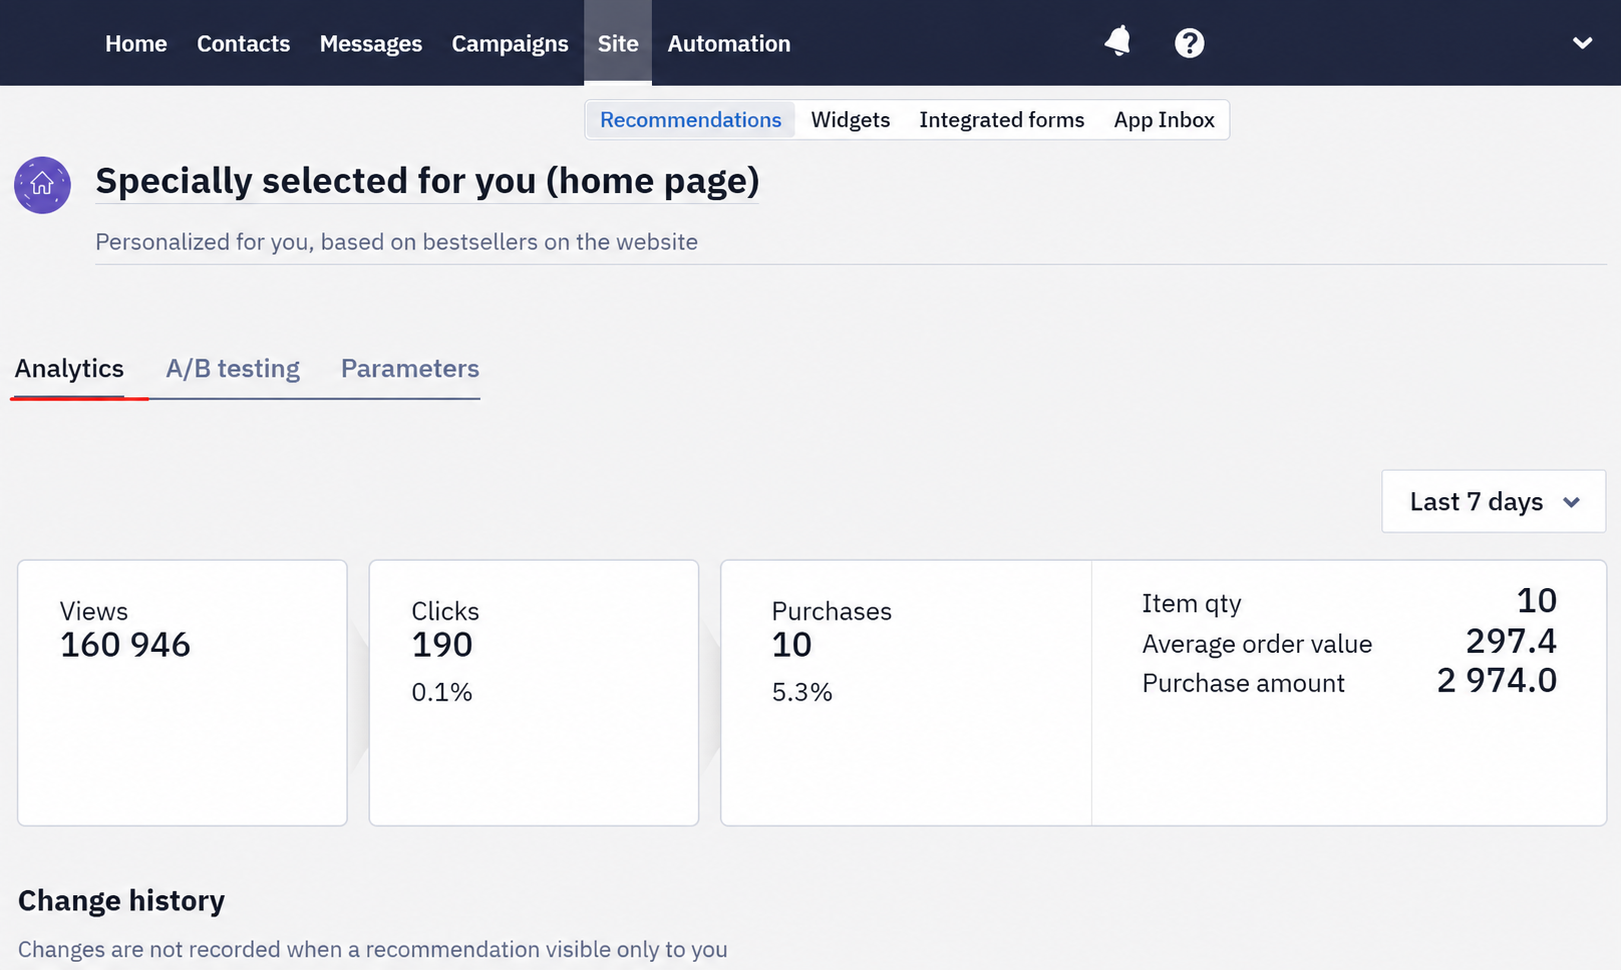
The first block of the report is a funnel: views → clicks → purchases. You can choose the analytics period: today / 7 days / 28 days / current month / previous month / all the time / period.
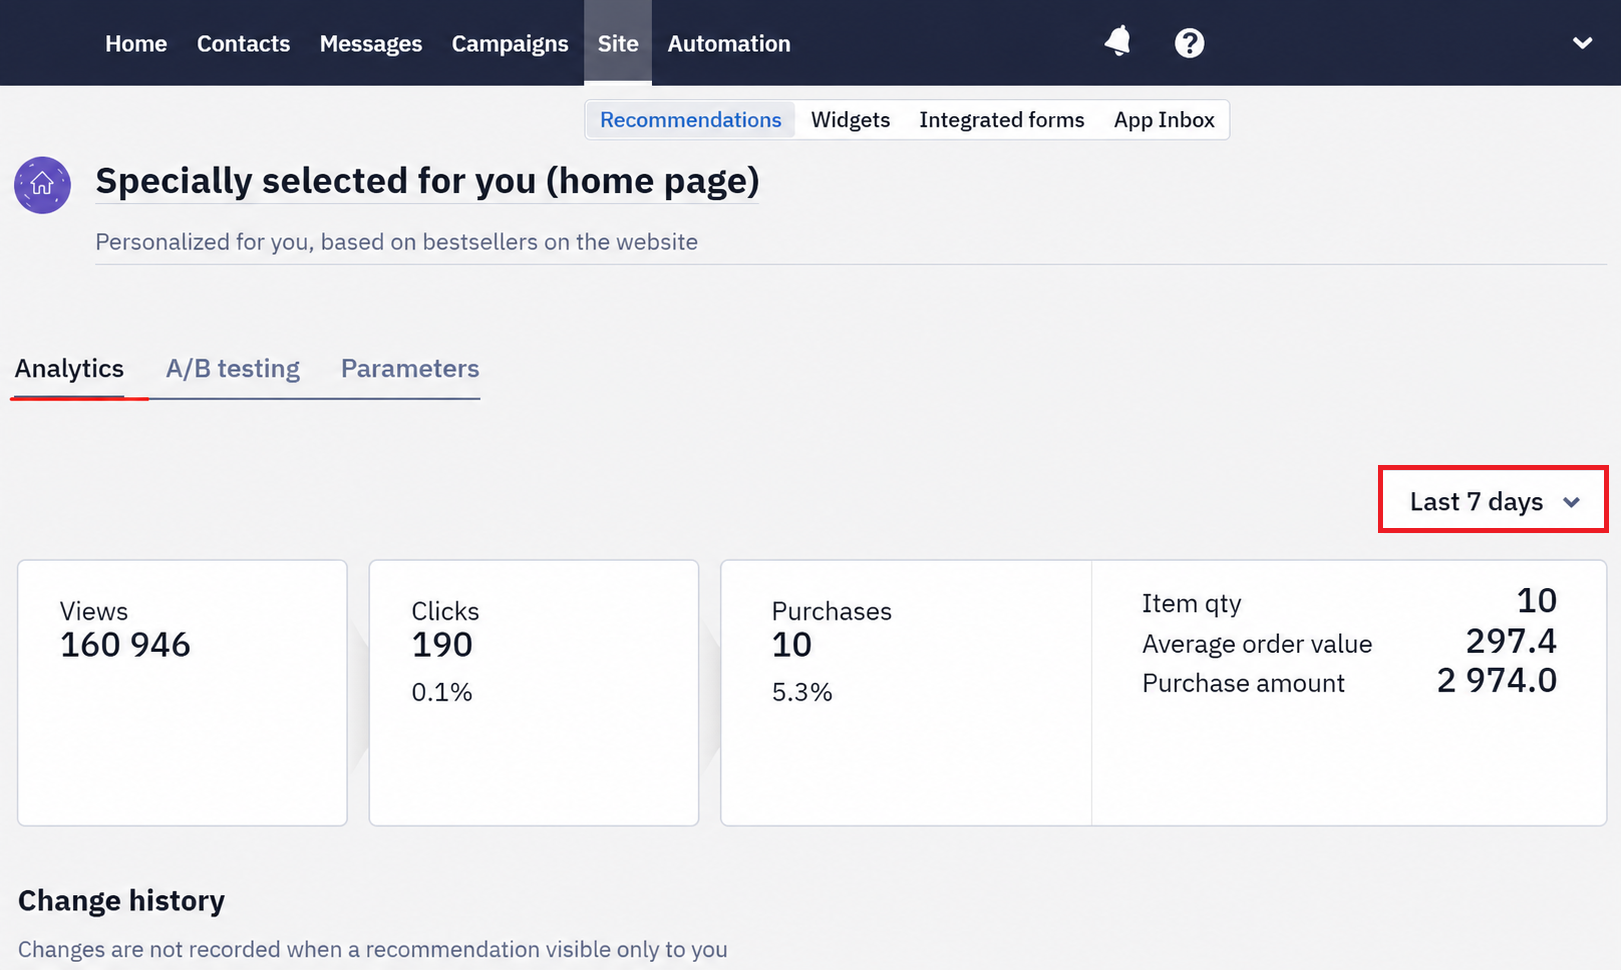
The percentage of clicks and purchases is displayed in relation to views.
At the bottom of the report you will find a history of changes with the date and description of the changes made. The history of changes is recorded only if the recommendation is visible to site visitors.
You can always go back to any of the recommendation setup steps to make changes. Test different algorithms and approaches to get the best results.
See instructions for conducting A/B tests
NoteThis analytics report tracks web recommendation blocks via the
sc_contentparameter, which is only passed with the web JS API response. Reusing the same recommendation block ID for a mobile app (via SDK) does not automatically produce analytics — mobile apps don't receivesc_content. To track views, clicks, and purchases from a recommendation block in a mobile app, create the recommendation using the SDK-specific block type and send the corresponding tracking events (impressions, clicks) from the app, as described in the iOS and Android recommendation SDK references.
Updated 3 months ago