
Event Analytics
The Event analytics section presents a list of events with their statistical indicators.
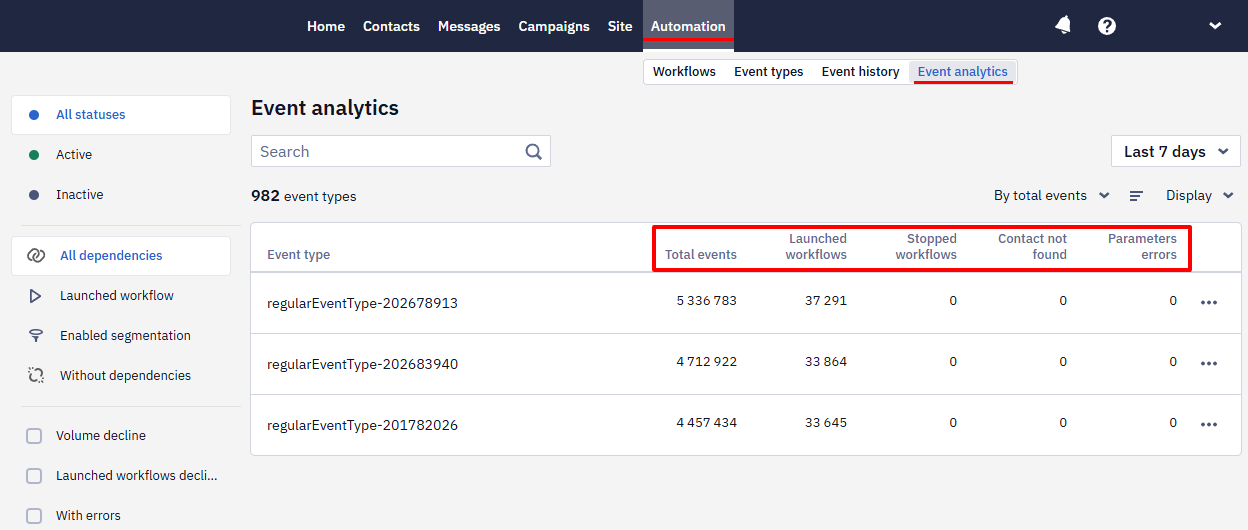
When clicking on an event, a window with graphs will open.
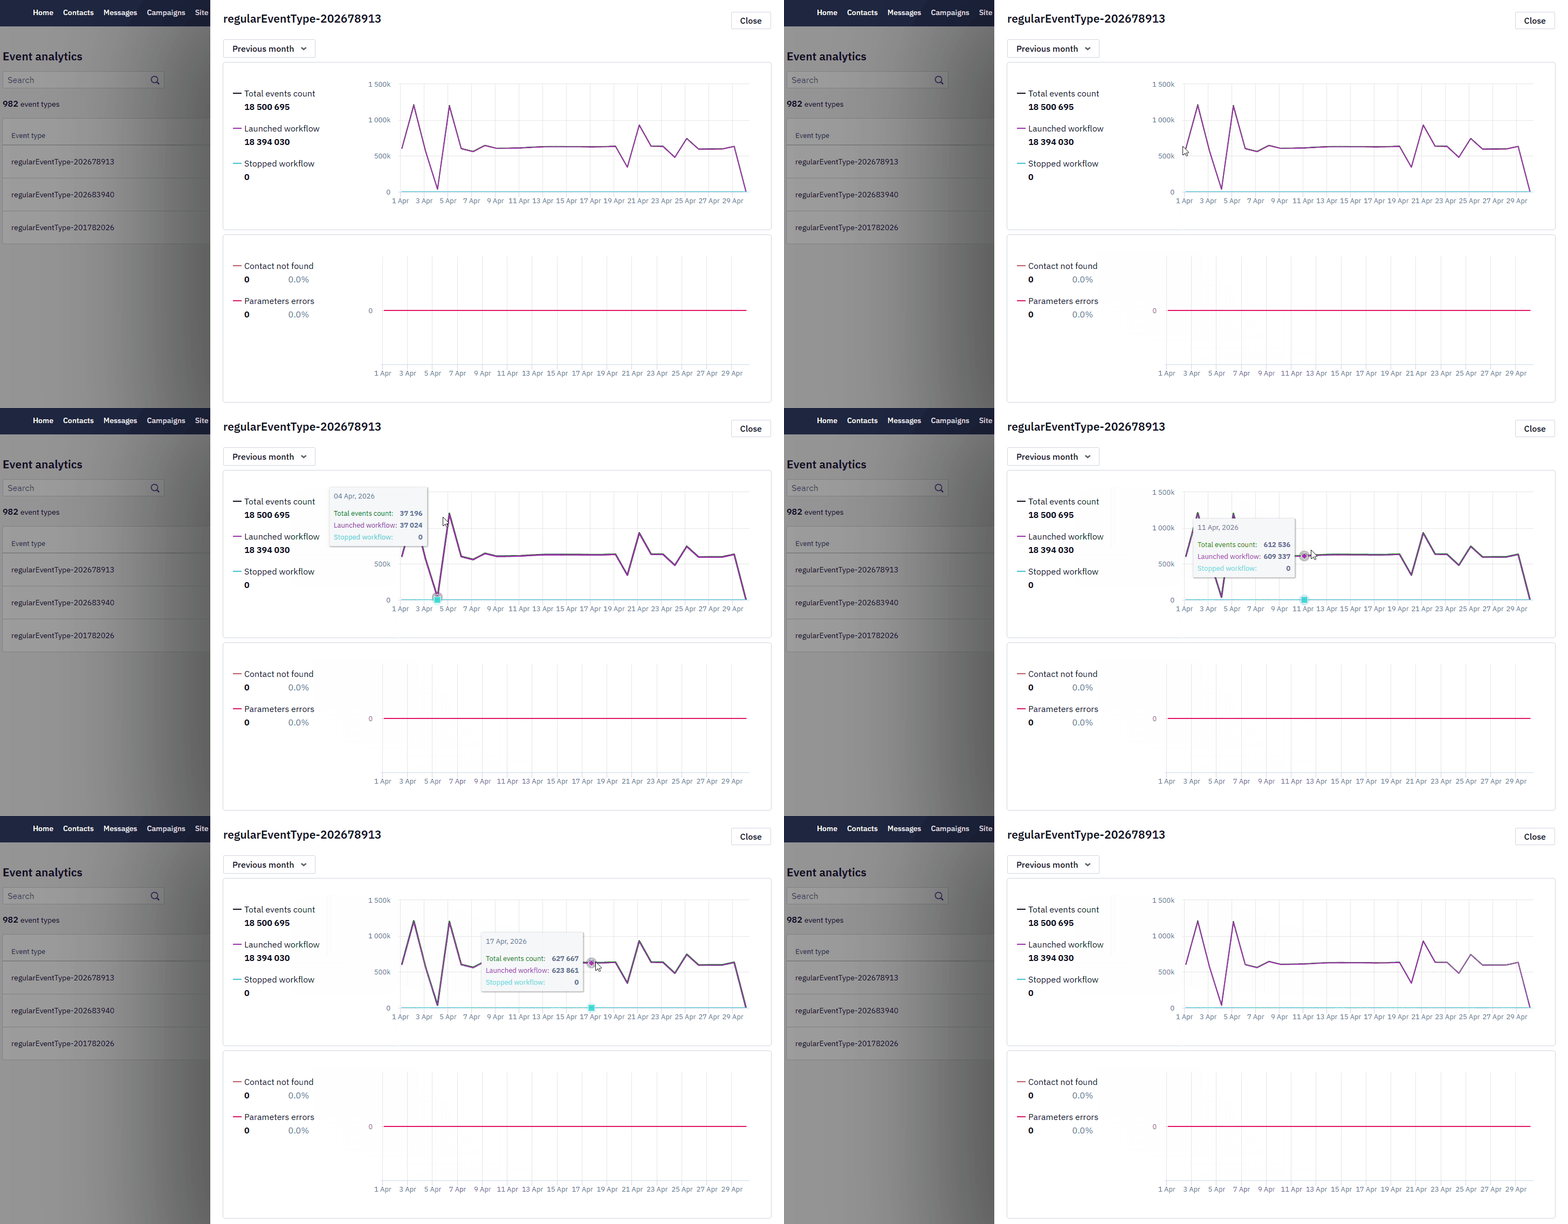
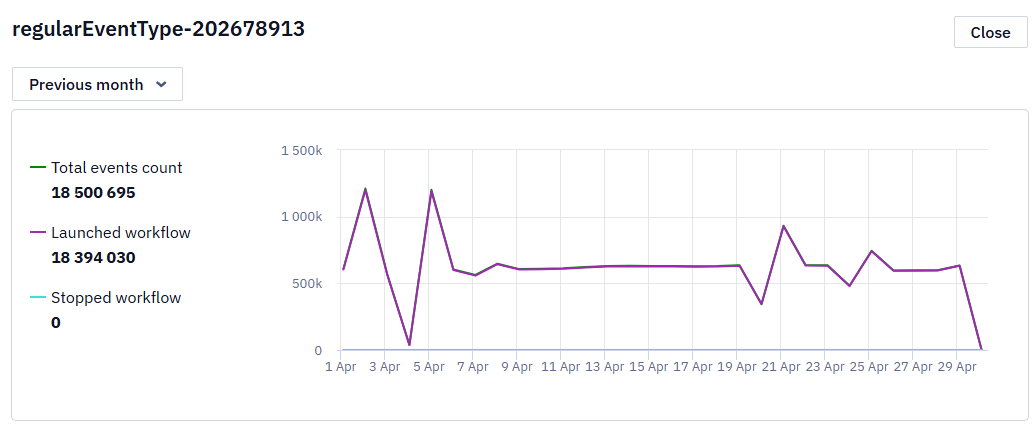
The top graph allows you to analyze indicators of event and workflow activity and includes the following categories:
- Total events count
- Launch workflow
- Stop workflow
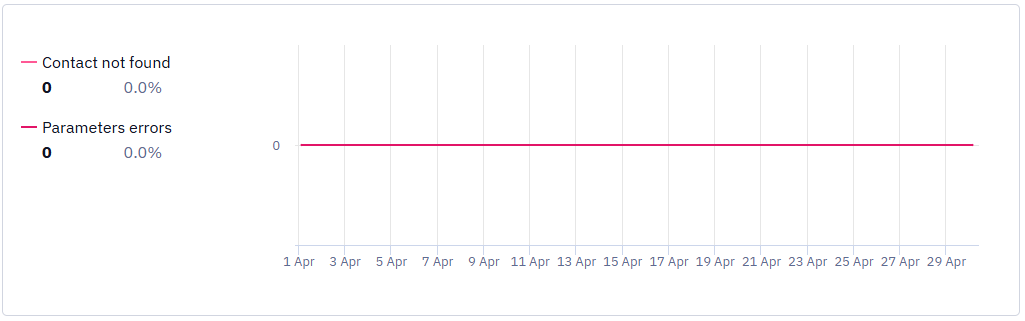
The bottom graph allows you to analyze errors and includes the following categories:
- Contact not found
- Parameters errors
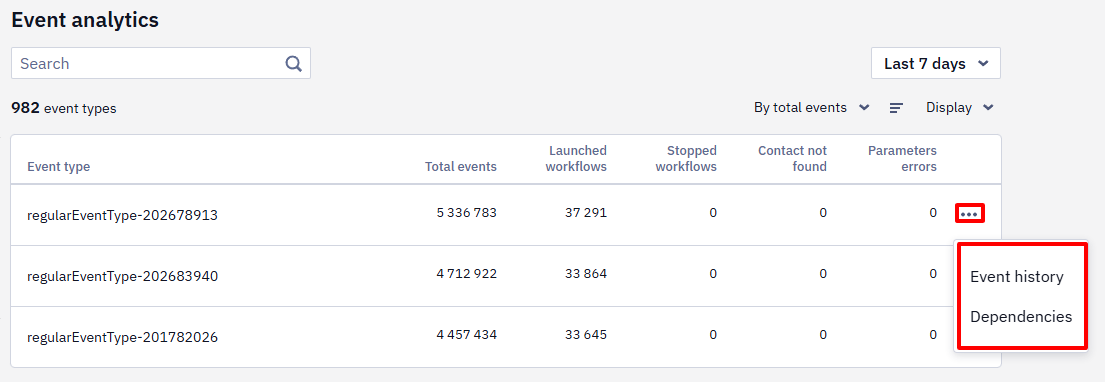
Click on the three dots next to the event name to view the event's history, structure, and dependencies (including related workflows and dynamic segments).
NoteThe report's data is collected hourly and isn't recalculated after a deletion, so events removed with Delete past events keep appearing here after they are gone from segmentation and from the contact's history.
Filtering Events
Sidebar
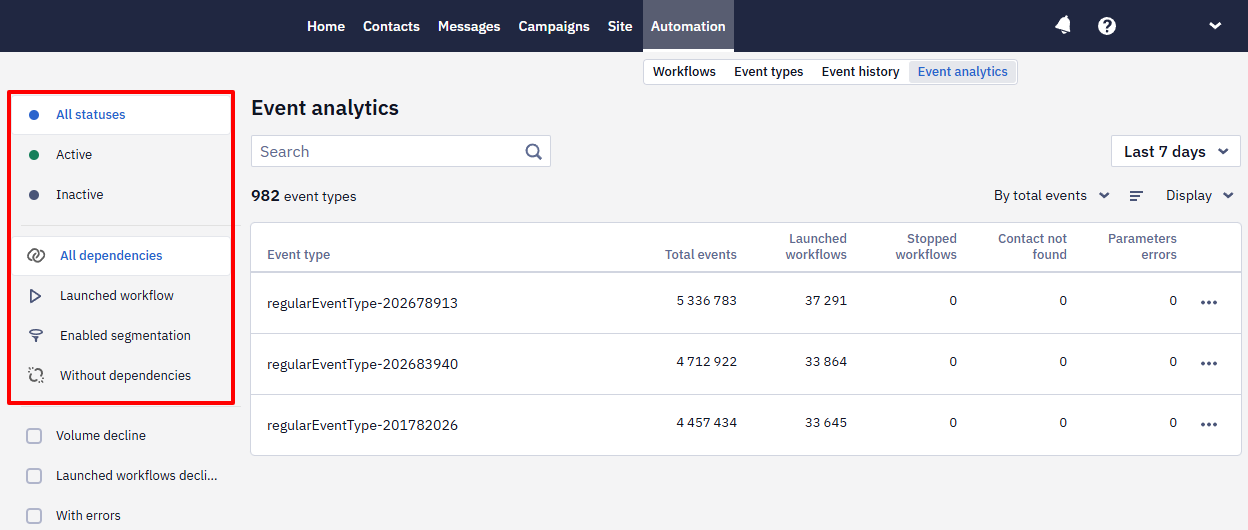
Use the left sidebar to sort event types by activity and dependencies.
The Active filter shows the event types that received at least one event over the last eight days. It is counted for the whole account and doesn't depend on the period selected in the report, so the number of active types can differ from the number of event types that arrived over the selected period.
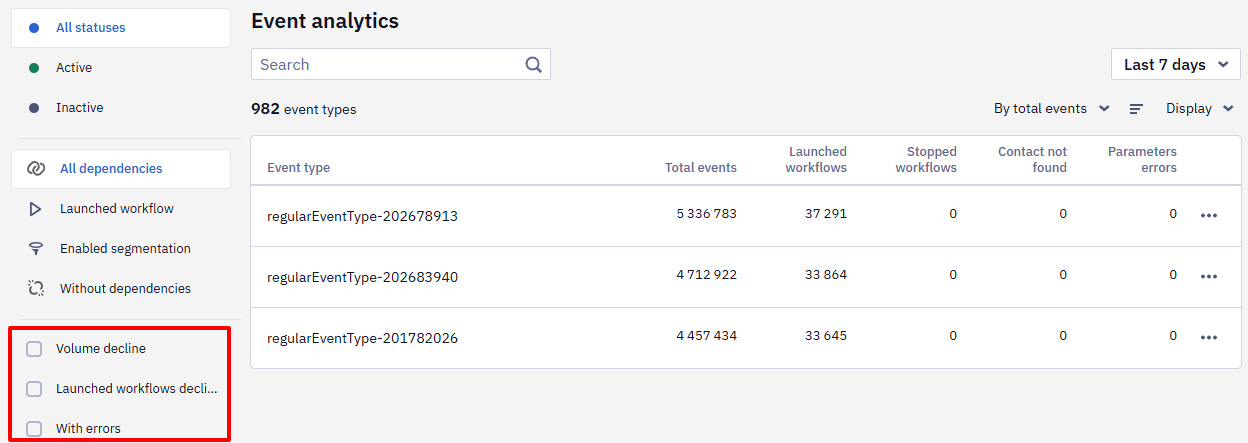
And also by metrics:
- Volume decline
- Launched workflow decline
- With errors
Period Tab
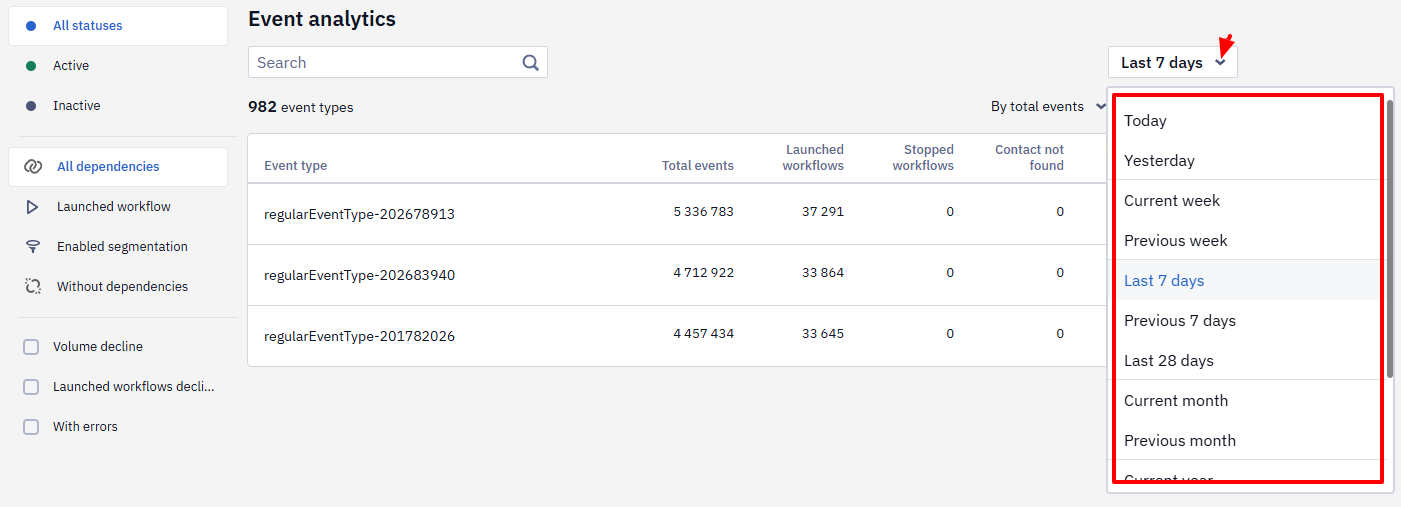
You can customize the data display on the Period tab for different time intervals.
Daily values are calculated in the account timezone.
Additionally, there is a set of additional filters at the top for tracking specific metrics.
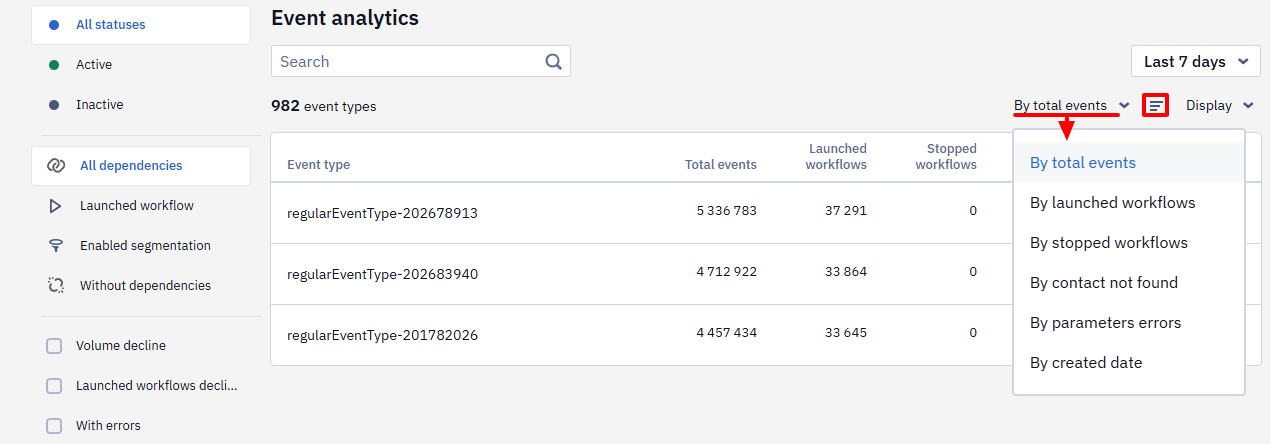
You can sort from highest to lowest value and vice versa.
Display Tab
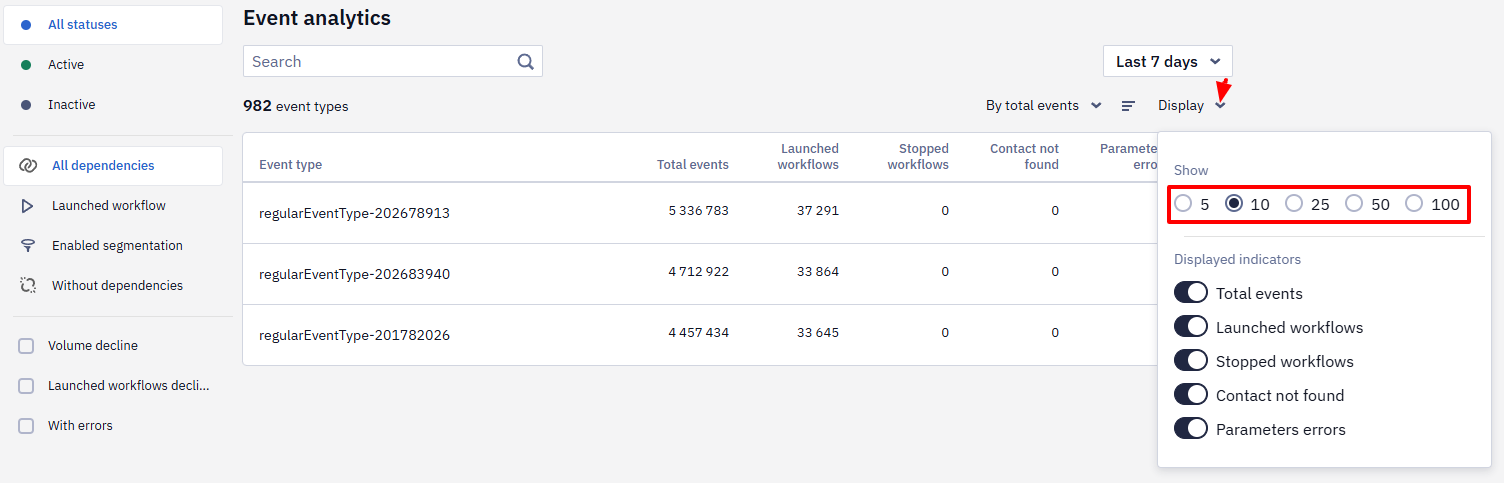
The Display tab allows you to:
- Change the number of events displayed on the page: 5, 10, 25, 50, or 100.
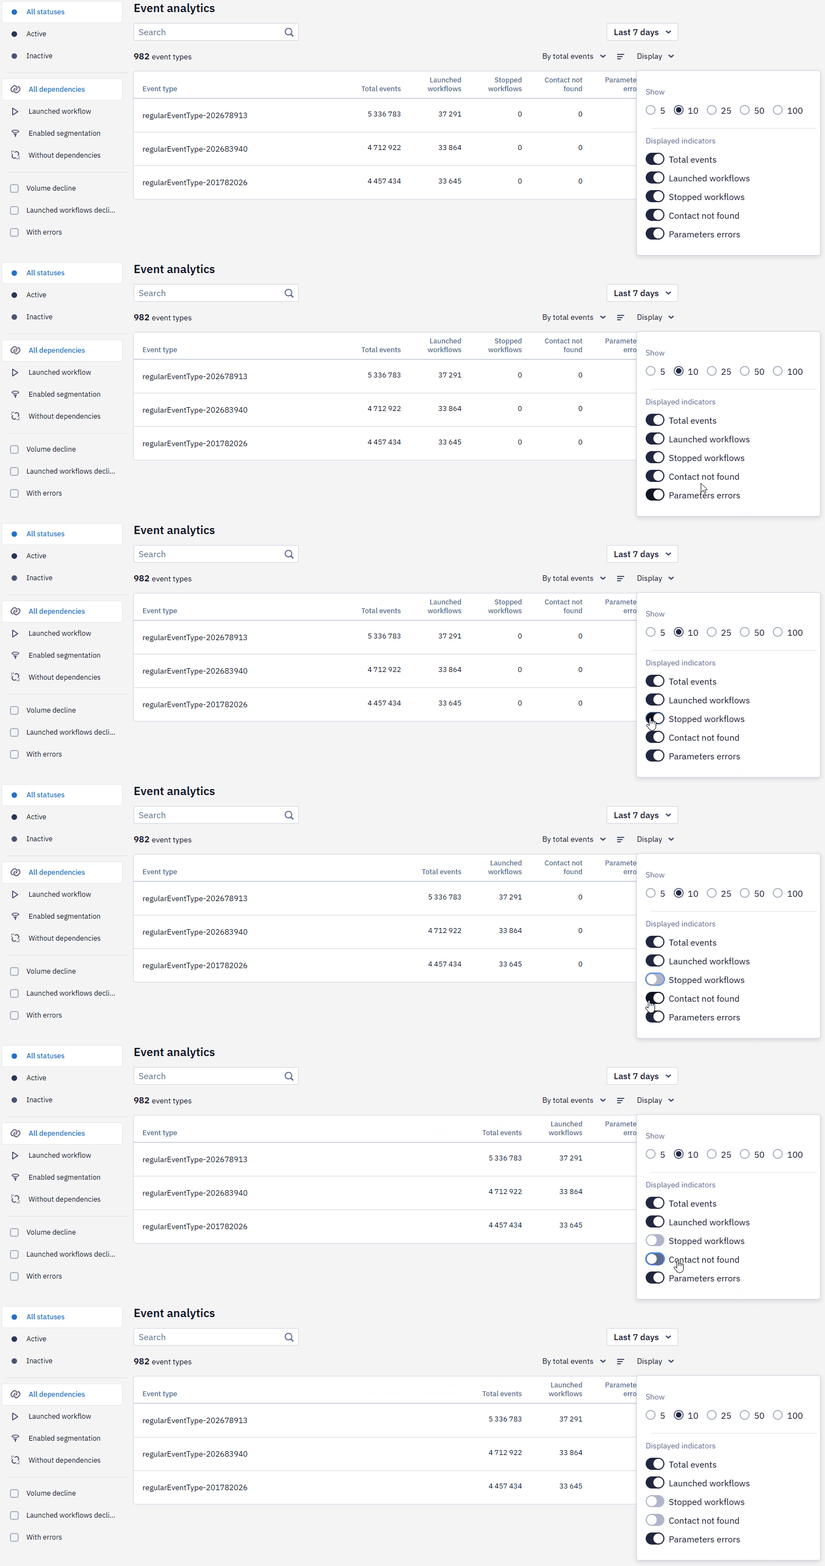
- Hide columns with metrics from the list if they are not interesting to you.
Event Search
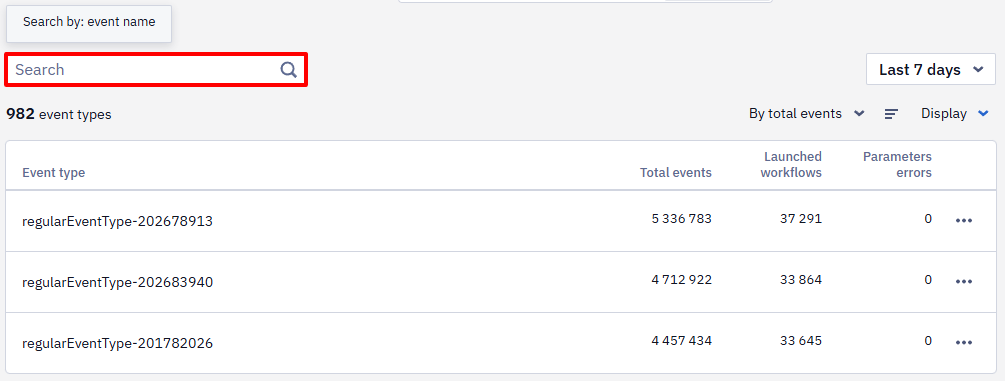
To find a specific event, enter its name in the search bar.
Updated about 1 month ago